Note on the PCE report

Wanted to send you all a note on the ‘crazy’ inflation report making headlines today.
Zero Hedge is as good an example as any:

Here’s state-owned Bloomberg News:

Let’s have a look at the actual PCE price index time series:
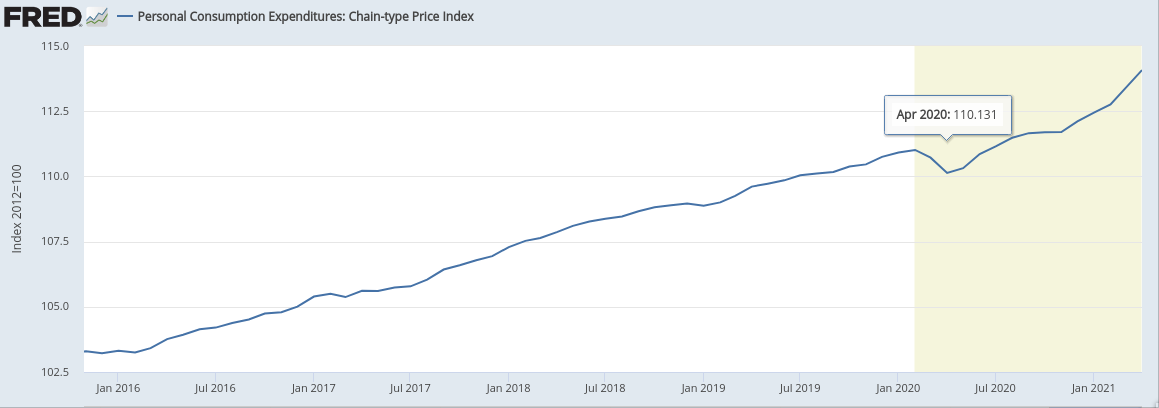
Here’s the same series, in year-over-year % change terms, with two extra years of data:

Indeed, the latest data point does look impressive, all the way up there at 3.5%, well outside the experience of recent history. Two things to note:
April 2020, the denominator for the latest year-over-year % change figure, is the nadir of the deflation seen during the initial corona virus freak out. A low denominator inflates the percentage change of a numerator. If you mentally extrapolate the PCE time series, prior to 2020, you’d end up with a forecast for April 2021, not too far from the current data point. It’s really not that wild of a number, a mean reversion just above trend.
On the second graph, you see the Fed has systematically failed to hit their 2% inflation target in recent years (technically they target the ‘core’ version of the index, doesn’t change the conclusion). They broke 2% inflation for a few months during the reign of the Bad Orange One, but generally they undershoot. They don’t appear to actually want an average of 2%.
According to the Fed’s current policy, the FOMC is planning to deliver a period of inflation above 2%, to make up for years of failing to hit their own target. Another way to word this is that the Fed intends to cause money to flow through the economy a little faster (more nominal GDP growth), so that inflation is like it was in the late 1990s. This higher rate of spending growth is intended to speed up the recovery from the corona virus freak out, and to give symmetry to Fed policy vis-a-vis the 2% inflation target.
It’s unlikely the Fed will be able to stick with this policy. As more reports come in, reporting or implying PCE inflation in excess of the magic 2% threshold, commentators with a lot more clout than Zero Hedge will pile on, accusing the FOMC of irresponsibility, of ‘destroying the dollar’, or ‘hurting working people via inflation’. Still, the market thinks the Fed will deliver on its promise, as the graph below shows.


If the market expects 2.5% average CPI inflation (implies ~2.3% PCE) over the next five years, but the Fed gets cold feet and only delivers, say 1.8% PCE…that implies a market correction, sooner or later. Not investment advice, just one man’s take. I for one will be keeping an eye on the five-year break even, and avoiding exposure to NGDP-sensitive equities and index funds until TIPS breakevens come down.
The way to monitor this thesis is to keep an eye on what ‘regime’ media say about inflation. If you see them down play it, or talk about how it’s a reflection of a stronger economy, then lower your probability weighting on a major correction. Still, 2.6% CPI inflation, for five years is a hard sell. It’s got to come down at least a few tenths of a point, which will weigh on the S&P 500.
Conclusion
The next few months of data will continue to generate alarmist headlines like we saw today. This will kindle social and institutional pressure on the FOMC to tighten effective policy (talk down markets). This in turn will result in lower NGDP growth than markets currently expect, and lower inflation than is currently anticipated. So while the acceleration in inflation is a normaltively acceptable trade off for higher NGDP growth, the current fetish in economic/policy culture for low inflation ensures the good times won’t last long, and that markets, by extension, are likely over valued.