


People are freaked out about inflation; I think they have the wrong idea.
Inflation is a tricky subject. I have a useful, simplified model of how the economy works in the back of my mind, and the temptation is to dive in and start showing charts. But I think it’s worth taking a little time to summarize the assumptions here.
First off, let’s try to define “inflation”. Many will see one particular price rise , become ticked off, because it’s a thing they wish to buy. They’ll then insist inflation is horrendous, Weimar, Zimbabwe, Turkey.
Inflation is really intended, conceptually, to measure broad-based, economy wide, depreciation in purchasing power for a fixed amount of money. You can have relative price changes that hurt well being (college costs, housing in specific cities go up more than hamburgers and gasoline), without having a true inflation problem. Without seeing uncontrolled, broad-based deterioration in the purchasing power of money.
Inflation is not a universal measure of well being and human happiness. Back in the late 80s, yearly inflation was 3-5% per year, and arguably most households were better off, on the deep measures of well being, than they are today. Inflation simply tells us the percentage change in a price index between two periods, usually in year-over-year or month-to-month, expressed as an annual rate by compounding 12 times.
Inflation is a percentage change in a price index; a price index is a useful statistical construct that seeks to measure changes in prices, over time. An index aggregates and simplifies many time series into a single series, in simplifying, you lose some detail, but also a lot of noise. It’s just a tool, it’s not handed down by God. There are problems measuring prices over time, because the mix of goods change over time. Still, I bought grass fed ground beef yesterday for $6 a pound. That’s about what I paid a decade ago. Now, this is one price, in one store, but I would not be paying $6 a pound if we were reliving Germany in the early 1920s. When we look at rents, they’re up, but really, not so much more than they were a decade ago.
There are many price indices, measuring different things and applying different methodologies to account for the changes in goods over time. When you see “inflation” discussed in the US media, they are probably speaking about one of two families of price index: the older CPI indices, which were developed, among other things, to index government transfer payments and tax brackets to inflation, or the Personal Consumption Expenditures (PCE) indexes, which are used to map household consumption spending and personal income into “real” (inflation adjusted) terms.
The chart below, shows us the two leading PCE indexes. The blue line attempts to measure the price level for everything households typically buy (so no industrial equipment or heavy weapons systems), the red line measures everything households buy, except food and energy, which as commodities, are highly “flexible” prices, and thus tend to go up and down a lot without as much “signal” about longer term inflation. Anyway, you can see the blue series which includes energy prices, is below the red, this is because of the collapse in oil prices in 2014.

The main point in showing this chart is to demystify inflation for people who don’t look at this stuff all the time. There’s no doubt about it, the latest reading (August ‘21) for the broad index is 116.31, the last reading before the virus freakout got going, February 2020, was 111.07. So 116.31/111.07 -1 = 4.7% inflation in 18 months, that’s 3.1% when expressed as an annualized rate. 3.1% inflation is indeed pretty high by recent standards, you have to go back to the early 90s to see sustained inflation rates like that. However, within a context of a crippling global hysteria about a nasty nursing home virus, it’s absolutely unremarkable. In fact, 3.1% inflation shows us how resilient the US and global logistics systems have been.
When you consider all the economic upheaval, the factory shut downs, the bottlenecks, the loss of labor due to hastened retirements, and sackings of those who don’t want mRNA injections, we’re lucky to only have 3.1% average annualized inflation since February 2020.
Let’s look at another chart. Below we see US (nominal) GDP. This is the total amount of spending in the US economy, on final goods and services. For the US economy to run well, we need about 4% growth, year after year, in (nominal) GDP. Money has to flow, has to be spent, for economic activity to take place, and flow needs to grow, year after year, for complicated reasons. Also, because the Fed controls the production of US dollars, it turns out the Fed is basically the “causal agent” in determining the approximate path of this line.

Take a look at the dip in the blue line in 2020, that’s the virus recession, an appalling, horrendous collapse that could have easily resulted in a world-historical depression, were it not immediately corrected. However, it was corrected. The Federal Reserve and US Federal Government were able to calm everyone down enough that spending popped back up in late 2020. GDP continued to rebound through 2021, and we’re now basically back to where we “should” be if there’d been no virus freakout and hysteria at all, around 23 trillion dollars in annualized spending.
Markets basically anticipated this strong rebound in the economy, which is why you saw stocks and commodities rebound sharply in the second quarter of 2020, and continue to rise as time went on, and the Fed made it clear it was willing to endure above average inflation, if that was the cost to support the economy. I’m on record as saying the Fed would get cold feet late summer/fall 2021, and back off, but that hasn’t happened. Good for the Fed, I’m happy to be wrong about them.
3.1% inflation, within a context of a strong economic recovery, and transportation and production bottlenecks, resulting from months of missed activity in 2020, ain’t too bad. I expect we’ll have continued abnormally high inflation in the next year or two, but still at manageable rates, and against a backdrop of a broadly strong economy.
One relevant aspect we see vis-a-vis inflation, is a labor “shortage” (perspective of firms), or a “good job market” (perspective of normal humans). A lot of older people, already on the fence about continuing to work, quit because of the virus, so we’re processing the effect of more retirees than usual. On top of this, you also have lots of service workers now required to breath through a surgical mask all day, which is just wretched for them. A lot of people, marginally attached to the labor force, probably left or are staying out because of this. The death rate for healthy people is also above normal, due to blood clots from the mRNA injections, which has a small effect too. Most importantly for the near term, we have the injection mandates, which have yet to show up in the data.
In short, the unreasoned, superstitious response to the virus has resulted in a huge “supply side shock” to the economy. Got to pay more to get someone to deal with ingrate customers and breath through a nasty cotton mask, so prices need to rise to reflect greater labor costs. Basically the rules of the game have changed in a way that makes it more expensive to do many types of business activities, so you move to a higher price level, and have less real production than you would, absent the supply shock.
Closing thoughts
So yes, there is abnormally high inflation, but so far it’s really nothing to get worked up about. We’ll probably continue to have abnormally high inflation for at least a year, maybe two. The high inflation is principally the “fault” of whomever is responsible for the sustained virus hysteria, not the Fed. The Fed could combat inflation, but this would require pulling down nominal GDP, which would be insane and cause a recession. The Fed is making the best of the situation, doing a brilliant job. Importantly, the Fed is not driving nominal GDP, the flow of spending through the economy, up in an unreasonable way, this is not a hyper-inflationary situation.
I want to show you one more chart. Below we see the Fed’s favored inflation series, year-over-year percent change in the PCE less food and energy (red line from the first chart). A red bar is added at 2%, following the Great Recession 2008/2009. The point here is that the Fed had systematically failed to hit it’s 2% inflation target, excluding a few months during the Trump administration. I believe the Fed sought to “stockpile inflation capital” during this period (2010-2019). Basically, they held the economy back, in case there was a major supply side recessionary event, so in that case, they could run the economy “hot” for a while, and, at the scale of decades and years, still hit their 2% average inflation target.
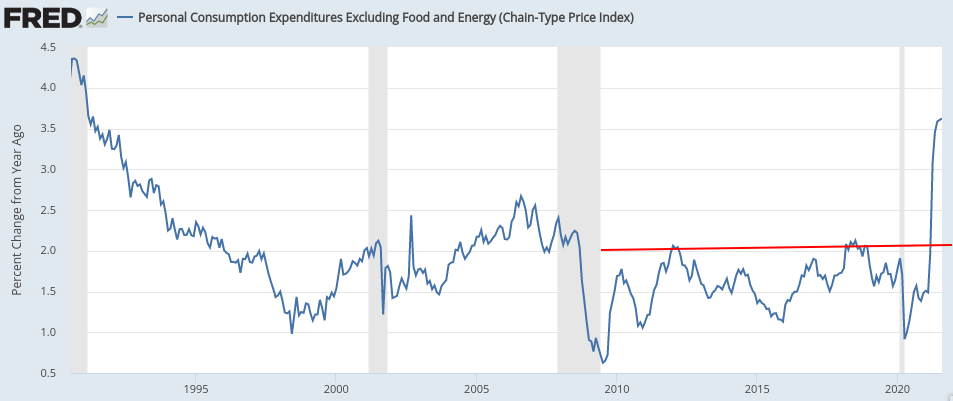
If this price index had grown at the Fed’s target rate of 2% per year, starting in January 2010, we’d currently be at an index value of 121. Instead, because the Fed undershot for years and years, we are only at an index level of 118, as of August 2021, despite all the virus-associated inflation. That is, the USA’s price level is a full 2.5% below where we’d be, if we’d had a (very modest) 2% inflation rate, since 2010.
We will see prices move above a long term 2% trend line in the next year. However, in 2023, we will work through the shipping and production bottlenecks, we’ll find some way of accommodating spooked, hypochondriac employees and customers, through a mix of reduced media terror and the security blanket of Big Pharma Ivermectin analogues. This will result in a “supply side” boost to the economy. The Fed will also tap the breaks a little in 2023, probably, pulling nominal GDP growth down to 4% or so. The Fed will, then resume it’s policy of undershooting the 2% inflation target, so that it can start banking inflation “capital” for the next unforecastable supply side disaster.
The major risk to this forecast is the possibility that the mRNA injections have done major, permanent damage to the inoculated. If two or three billion people have their health seriously undermined, of course, we are totally screwed, headed for the largest disruption to human life since the Black Death. We simply can’t know if that will happen though, or what the probabilities are on various bad vaccine outcome scenarios. My gut feeling is that the vaccines will probably only kill or cripple a few million people, globally, but that by the fourth booster, most will wise up and stop taking them. The vast majority will gradually recover their innate immunity, and ability to form natural antibodies against SARS-2 variants, and everything will be OK.